
Updated on Jun. 26, 2026
Position: Resource - Disk Utilities - SSD Benchmark Software: 15 Best Tools to Test Read & Write Speed (2026)
NVMe SSDs are everywhere now. PCIe Gen 5 drives are shipping, and most new laptops come with at least a Gen 4 drive inside. But don't assume storage has gotten cheaper. NAND flash prices have been climbing these days, driven by surging AI demand and tightening supply. You're paying more for every gigabyte than you were two years ago. So when a spec sheet promises "7,000 MB/s," you'd better know whether that number holds up in the real world. Controller quality, firmware quirks, NAND type, thermal conditions, even the capacity you choose, all of these affect actual performance. That's where SSD benchmark software comes in.
A good benchmark tool lets you measure actual read and write speeds, spot bottlenecks, and verify that a new drive is performing the way it should. Whether you're a gamer double-checking a fresh install, a video editor evaluating sustained write speeds, or an IT admin managing a fleet of machines, benchmarking is the way to get real numbers instead of marketing ones.
SSD benchmark software works by simulating data read and write operations at various block sizes and queue depths. The results tell you how fast your drive actually is, not how fast a marketing department wants it to be.
Verifying manufacturer claims. Every SSD ships with a rated speed on the spec sheet. Those numbers reflect peak sequential performance under ideal lab conditions. In practice, your results will vary depending on the controller, the firmware revision, the NAND flash type, and whether the drive starts thermal throttling halfway through a test. Benchmarking closes the gap between what was promised and what was delivered.
Diagnosing performance degradation. SSDs slow down over time. It's not always dramatic, but it happens. Firmware bugs, a lack of TRIM support, or simple NAND wear can all eat into performance. If your system felt faster six months ago, a benchmark can confirm whether the drive is the culprit.
Pre-purchase validation. Bought a new SSD on sale? Run a benchmark before the return window closes. A drive that underperforms by 30% or more compared to its rated specs might be defective, or it might just be a model known for aggressive SLC cache behavior. Either way, you want to know early.
Troubleshooting a slow system. When a computer feels sluggish, the cause isn't always obvious. Is it the CPU? The RAM? A background process? Benchmarking the SSD eliminates one variable quickly. If your drive is hitting expected speeds, the problem lies elsewhere.
Gaming and creative workloads. Gamers care about random 4K read speeds because those affect load times. Video editors care about sustained sequential writes because dropping frames during a render is not an option. Different tools emphasize different test profiles, and choosing the right one matters.
Comparing drives. Upgrading from a SATA SSD to an NVMe drive? Or maybe from a Gen 3 to a Gen 4? Running the same benchmark on both drives gives you an apples-to-apples comparison that spec sheets alone can't provide.
Identifying hidden bottlenecks. Sometimes the SSD itself is fine, but something in the chain is holding it back. SATA interfaces cap out around 600 MB/s. Running an NVMe drive through a PCIe x2 slot instead of x4 cuts bandwidth in half. Thermal throttling kicks in during sustained writes. Driver issues cause intermittent slowdowns. Benchmarking helps you pinpoint which link in the chain is weakest.
Monitoring SSD health. Some benchmark tools do double duty. They report S.M.A.R.T. attributes alongside speed data, giving you a fuller picture of where your drive stands. Tools like DiskGenius, HD Tune, and AIDA64 include health monitoring as a built-in feature rather than an afterthought.
Short answer: no, not in any realistic scenario.
Modern consumer SSDs are typically rated for hundreds of terabytes written (TBW). A single benchmark run writes somewhere between 1 GB and 10 GB of data. Even if you ran a benchmark every single day, you'd write maybe 300 GB in a month. That's a rounding error against a 600 TBW endurance rating.
Where things get slightly different is with stress tests. Tools like PCMark 10's Performance Consistency test can write upwards of 23 TB in a single session. That's still well within spec for any modern drive, but running it daily would be pointless. For routine checkups, a standard benchmark a few times per month is perfectly safe and won't meaningfully affect your SSD's lifespan.
Not all benchmark tools are built the same. Before you download one, it helps to know what separates a good tool from a mediocre one.
Compatibility. Does the tool support your SSD's interface? SATA, NVMe, M.2, U.2, these are all different connections with different performance ceilings. And obviously, the software needs to run on your operating system. Most benchmark tools are Windows-only. Mac users have fewer options, and Linux users often rely on command-line utilities.
Test types. At minimum, you want sequential and random (4K) read/write tests. Sequential speeds matter for large file transfers. Random 4K speeds matter for everything else: boot times, app launches, general responsiveness. The best tools also let you test at different queue depths and thread counts.
Customization. Can you change block sizes? Adjust the test file size? Set queue depth manually? These options matter because a 1 GB test file with QD1 will tell you something very different than a 10 GB test file with QD32. Fixed, non-adjustable tests are fine for quick checks, but serious benchmarking requires flexibility.
Ease of use. Some tools are "click one button and wait." Others present a wall of settings that intimidates newcomers. Neither approach is wrong; it depends on your experience level and what you need from the test.
Additional features. Health monitoring, S.M.A.R.T. data display, data recovery, partition tools, disk cloning. Some utilities bundle benchmarking into a larger toolkit. If you only need speed numbers, a lightweight dedicated tool is cleaner. If you want an all-in-one disk management solution, a suite like DiskGenius saves you from installing three or four separate programs.
Free versus paid. Most SSD benchmark software is free for personal use. A few tools, notably PCMark 10 and 3DMark, require a paid license. Free tools cover the needs of the vast majority of users.
Resource footprint. A portable tool that runs from a USB stick without installation is handy for field work. A 500 MB suite that installs background services is not. Consider how and where you'll be using the tool.
Before diving into individual reviews, here's a side-by-side look at what each tool offers:
| Tool | Sequential Test | Random Test | IOPS Test | S.M.A.R.T. Data | Temp Monitoring | Best For |
| DiskGenius | Yes | Yes | Yes | Yes | Yes |
All-in-one disk utility |
| CrystalDiskMark | Yes | Yes | Yes | No | No | Quick SSD speed tests |
| AS SSD Benchmark | Yes | Yes | Yes | No | No | SSD-specific benchmarks |
| ATTO Disk Benchmark | Yes | Partial | No | No | No | Peak throughput testing |
| Blackmagic Disk Speed Test | Yes | No | No | No | No | Video production |
| Anvil's Storage Utilities | Yes | Yes | Yes | No | No |
Advanced analysis |
| PCMark 10 | Yes | Yes | No | No | No | Real-world workloads |
| 3DMark Storage Benchmark | Yes | Yes | No | No | No | Gaming scenarios |
| DiskBench | No | No | No | No | No | File transfer performance |
| HD Tune | Yes | Partial | No | Yes | Yes | Benchmark and diagnostics |
| Samsung Magician | Yes | Yes | No | Yes | Yes | Samsung SSD owners |
| HDDScan | Limited | No | No | Yes | Yes |
Health monitoring |
| AJA System Test | Yes | No | No | No | No |
Media workflows |
| PassMark PerformanceTest | Yes | Yes | Yes | No | No | Comprehensive testing |
| AIDA64 | Yes | Yes | Yes | Yes | Yes | Enthusiasts and IT pros |
The following are Reviews of each tool:
DiskGenius is primarily known as a partition manager and data recovery tool. The version 6.1 introduced the disk speed test feature.
Instead of installing a separate benchmark utility, you can test your drive's performance right from the same interface you already use for partitioning, migrating OS, or recovering lost files.
The speed test covers both sequential and random read/write operations. You can configure block sizes and test durations to suit your needs. Results are displayed clearly, showing transfer rates in MB/s for each test configuration. The tool also surfaces S.M.A.R.T. data, including temperature, power-on hours, and wear indicators, so you get health information alongside raw speed numbers.
What makes DiskGenius stand out is the combination. Partition management, disk cloning, bad sector detection, backup and restore, file recovery, and now benchmarking, all in one application. For IT professionals or anyone managing multiple drives, that consolidation matters. You don't need CrystalDiskMark for speed, CrystalDiskInfo for health, and a separate tool for partitioning. DiskGenius handles all three.

Free Download DiskGenius
Key Features:
• Sequential and random read/write speed testing
• S.M.A.R.T. health monitoring with temperature, power-on hours, and wear data
• Bad sector detection with real-time read speed display
• Partition management, disk cloning, backup/restore, and file recovery
• Supports NTFS, FAT32, exFAT, FAT12, FAT16, EXT4, EXT3, EXT2, ReFS
• TRIM optimization during format and clone operations
Pros:
• Replaces multiple tools with a single application
• Free version covers benchmarking, disk cloning and disk management needs
• Actively developed with regular updates
• Provides portable versions, and you can also run it from a USB stick without installation
• It can create WinPE based bootable USB drive
• Supports multiple languages
Cons:
• Windows only; no macOS or Linux support
Verdict:
A strong choice for users who want benchmarking as part of a broader disk management toolkit rather than as a standalone activity.
CrystalDiskMark is probably the first name that comes to mind when someone mentions SSD benchmarking. It's free, it's lightweight, and it produces results that are easy to understand and compare across drives.
The tool tests sequential and random read/write speeds across a range of queue depths and thread counts. Version 8 introduced preset profiles (Peak Performance, Real World Performance, and a Mix mode) that configure test parameters automatically, which is helpful if you don't want to manually set block sizes and queue depths. For power users, everything remains fully adjustable.
One thing it doesn't do is health monitoring. There's no S.M.A.R.T. display, no temperature readout, no wear indicators. For that, you'd typically pair it with CrystalDiskInfo, made by the same developer.
Key Features:
• Sequential and random read/write testing with adjustable QD and threads
• Three preset test profiles plus fully custom configurations
• Supports multiple languages
Pros:
• The industry standard for quick, comparable SSD benchmarks
• Dead simple to use
• Completely free
Cons:
• No S.M.A.R.T. or health monitoring
• Windows only
Verdict:
The go-to tool for fast, reliable speed tests. If all you need is a number, CrystalDiskMark delivers.
AS SSD Benchmark was built specifically for solid-state drives, and that focus shows. Unlike general-purpose disk benchmark tools, it tests with data patterns that better reflect how SSDs actually handle compression and incompressible data.
The tool runs sequential read/write tests, 4K random tests at various queue depths, and access time measurements. It produces a global score for each drive, which makes comparisons straightforward. Two additional tests set it apart: the Copy Benchmark, which simulates transferring ISO files, program folders, and game directories, and the Compression Benchmark, which plots performance across the full compression ratio spectrum.
The default test size is 1 GB, but you can increase it to 10 GB or more. This matters because larger test sizes help bypass SLC caching on modern NVMe drives, giving you a more accurate picture of sustained performance. Over 5 million people have used AS SSD Benchmark, and its results are a common reference point in hardware forums and review sites.
Key Features:
• SSD-specific test profiles
• Global performance score for easy comparison
• Copy Benchmark (ISO, Program, Game) and Compression Benchmark
• Adjustable test file size (1 GB to 10+ GB)
Pros:
• Purpose-built for SSDs
• Copy and Compression benchmarks offer unique practical insights
• Widely recognized results
Cons:
• Windows only
• Last updated several years ago; may have compatibility quirks with the newest Gen 5 drives
Verdict:
Still one of the best tools for SSD-focused benchmarking, especially if you want to see how compression affects performance.
ATTO Disk Benchmark has been around since the days of SCSI drives, and it remains a standard reference in the storage industry. SSD manufacturers frequently cite ATTO results in their spec sheets, which makes it uniquely useful for comparing your real-world numbers against official claims.
The level of customization here is exceptional. You can set I/O sizes from 512 bytes all the way up to 64 MB, adjust queue depths, define file sizes between 64 KB and 32 GB, and toggle Direct I/O mode to bypass the operating system's cache. There's also a Verify Data option that checks data integrity after writes, and a timed mode for sustained stress testing.
Key Features:
• Highly customizable: I/O size, queue depth, file size, and I/O type
• Direct I/O mode for bypassing OS write cache
• Data verification after writes
• Timed stress test mode
Pros:
• Industry standard; results directly comparable to manufacturer specs
• Extremely granular configuration
• Free
Cons:
• Interface is functional but dated
• No S.M.A.R.T. or health monitoring
Verdict:
The tool of choice when you need detailed, configurable throughput data and want to match your results against manufacturer benchmarks.
Blackmagic's offering is laser-focused on one audience: video professionals. The interface couldn't be simpler. A single window shows read and write speeds alongside a list of video formats (ProRes, DNxHD, 4K, 8K, and so on) with color-coded indicators showing which ones your drive can handle in real time.
There's no configuration to speak of. You set the test volume and a stress level (which controls file size from 1 GB to 5 GB), then click start. The tool continuously runs tests until you stop it, which gives you a sense of sustained performance rather than a single snapshot.
Available free on macOS (and Windows through the Blackmagic Desktop Video package), it's the de facto standard for filmmakers and editors who need to know whether their storage can keep up with their codec of choice.
Key Features:
• Video format compatibility display
• Continuous testing mode
• Adjustable stress level
• Free on macOS
Pros:
• Instantly tells you which video formats your drive supports
• Extremely easy to use
• Trusted in the film and broadcast industry
Cons:
• No random 4K or IOPS testing
• Can't log or export peak/average performance data
Verdict:
If you work with video, this is the first tool to run. For anything else, look elsewhere.
Anvil's is built for people who want to dig deep. It runs sequential tests at 4 MB block sizes, random 4K tests across multiple queue depths, and provides separate read and write scores plus a combined total. You can also adjust compression percentages, which is useful for testing how drives handle different data types.
One feature worth noting is the endurance test. Anvil's can run extended write workloads that give you a rough sense of how a drive performs under sustained pressure, useful for evaluating SSDs before deploying them in write-heavy environments like database servers.
Key Features:
• Sequential and random testing with adjustable QD
• Configurable compression percentage
• Endurance/stress testing capability
• Separate read, write, and combined scores
Pros:
• Deeply configurable
• Endurance testing sets it apart from simpler tools
Cons:
• Interface is cluttered and unintuitive for beginners
• Development has slowed; updates are infrequent
Verdict:
A power user's tool. Worth learning if you need granular control over test parameters or want to stress-test a drive before heavy deployment.
PCMark 10 takes a fundamentally different approach. Instead of raw throughput numbers, it simulates real-world tasks: launching applications, editing video, copying files, browsing the web. The result is a single score that reflects how your storage performs in everyday scenarios.
There are three test tiers. The Quick System Drive Benchmark runs in about 20 minutes. The Full System Drive Benchmark takes roughly an hour. And the Drive Performance Consistency test, which writes up to 23 TB of data, can run for 10 hours or more. That last one is genuinely extreme, and it's designed for reviewers and manufacturers testing sustained performance under worst-case conditions.
The trade-off is cost. PCMark 10's Advanced Edition, which unlocks the storage benchmarks, requires a paid license. For most home users, free tools cover the same ground. But if you need a defensible, application-level performance score, perhaps for a review or a procurement decision, PCMark 10 delivers what raw benchmarks can't.
Key Features:
• Application-level simulation (app launches, video editing, file copies)
• Three test tiers from quick to extreme
• Single comparable score
• Industry-recognized methodology
Pros:
• Results reflect real-world usage, not synthetic throughput
• The Performance Consistency test is among the most rigorous available
Cons:
• Paid license required
• Long test durations for the advanced tiers
Verdict:
The gold standard for real-world storage performance evaluation, if you're willing to pay for it.
3DMark's storage test is essentially the gaming-specific sibling of PCMark 10. It measures how your SSD affects gaming experiences: loading Battlefield V, installing Call of Duty, saving game progress, recording gameplay with OBS, and moving game files between drives.
The result includes both a bandwidth figure and an average access time. If you're building a gaming PC and want to know whether that Gen 4 NVMe drive actually makes a noticeable difference over a Gen 3, this test gives you a concrete answer.
Key Features:
• Gaming-specific workload simulation
• Tests loading, saving, installing, and recording
• Reports bandwidth and access time
Pros:
• Directly relevant to gaming performance
• Easy to interpret results
Cons:
• Paid license required
• Only tests gaming-adjacent workloads
Verdict:
A niche but valuable tool for gamers who want data-driven answers about storage performance.
DiskBench strips benchmarking down to its most practical form: actual file transfers. You create, copy, read, or move real files and directories, and DiskBench tells you exactly how long it took and at what average transfer rate.
No synthetic patterns, no queue depth adjustments, no bar charts. Just "this 4 GB folder copied in 3.2 seconds at 1,250 MB/s." That simplicity is either refreshing or limiting, depending on your perspective.
Key Features:
• Copy File, Copy Directory, Create File, and Read File tests
• Reports transfer time and average MB/s
• Minimal footprint
Pros:
• Results reflect actual file operations, not synthetic patterns
• Extremely lightweight
Cons:
• No sequential or random I/O testing
• No health monitoring or advanced configuration
Verdict:
DiskGenius for a complete picture.
HD Tune has been a staple of disk diagnostics for years. Its benchmark tab measures read (and in the Pro version, write) speeds across the entire drive, plotting the results as a line graph that reveals performance consistency from the first sector to the last.
Beyond benchmarking, HD Tune reads S.M.A.R.T. attributes and includes a surface scan for detecting bad sectors. The health tab flags any S.M.A.R.T. attribute that's outside normal parameters, and the temperature display shows both current and historical readings.
Key Features:
• Full-disk read speed graph
• S.M.A.R.T. health monitoring with temperature tracking
• Surface scan for bad sector detection
• Pro version adds write benchmarking and file benchmark
Pros:
• Visual benchmark graph reveals inconsistencies that a single number can't
• Combines benchmarking with diagnostics in one tool
• Free version covers basic needs
Cons:
• Write testing requires the paid Pro version
• Development has slowed in recent years
Verdict:
A solid diagnostic and benchmarking tool, especially valuable for the full-disk performance graph and S.M.A.R.T. monitoring.
Samsung Magician is Samsung's official SSD management utility. If you own a Samsung drive, whether it's an 870 EVO, a 990 Pro, or any other model in their lineup, this is the tool Samsung wants you to use.
It includes a speed test for sequential and random read/write performance, S.M.A.R.T. health monitoring, firmware update notifications with one-click installation, and performance optimization features like over-provisioning management. The interface is clean and modern, a noticeable step up from most free benchmark tools in the visual department.
The catch is obvious: it only works with Samsung SSDs. If your system has a Samsung boot drive and a WD secondary drive, Magician will happily test the Samsung and completely ignore the WD. That brand exclusivity is the main reason to keep a universal tool handy.
Key Features:
• Sequential and random speed testing
• S.M.A.R.T. monitoring with detailed health status/p>
• Over-provisioning and performance optimization
• Samsung SSDs only
Pros:
• Official tool from the largest SSD manufacturer
• Polished, user-friendly interface
• Combines benchmarking with firmware and health management
Cons:
• Useless if you don't own a Samsung SSD
• Less benchmark customization
Verdict:
Essential for Samsung SSD owners, limited for everyone else. If you manage drives from multiple manufacturers, a brand-agnostic tool like DiskGenius is more practical.
Despite the name, HDDScan works with SSDs too. It's a portable diagnostic utility that focuses on hard drive health more than raw speed, though it does include basic read tests.
The surface scan feature maps read time per block across the entire drive, producing a visual heat map that doubles as both a benchmark and a health diagnostic. Slow blocks stand out immediately. HDDScan also reads and displays detailed S.M.A.R.T. attributes, including temperature, reallocated sectors, and power-on hours.
Key Features:
• Surface scan with per-block read time mapping
• Supports ATA/SATA, USB, and FireWire drives
• Detailed S.M.A.R.T. attribute display
Pros:
• Excellent for diagnosing failing or degraded drives
• Small download size
Cons:
• May not recognize the newest NVMe drives natively
• Limited as a pure benchmark tool
Verdict:
More of a diagnostic tool than a benchmark tool. Reach for it when you suspect a drive has problems, not when you want clean speed numbers.
AJA System Test comes from AJA Video Systems, a company that makes professional video hardware. The tool measures read and write speeds using video-specific file sizes and formats, making it a natural companion to Blackmagic's speed test.
It's available on both macOS and Windows, which gives it broader reach than Blackmagic's Mac-centric offering. You can select different video codecs and resolutions as the test profile, and results are displayed with clear graphs showing sustained performance over time.
Key Features:
• Video codec and resolution-specific testing
• Available on macOS and Windows
• Graphical results with sustained performance tracking
Pros:
• Cross-platform (macOS and Windows)
• Focused on video production workloads
Cons:
• Limited to sequential testing
• Small user community; fewer comparison benchmarks available online
Verdict:
A good alternative to Blackmagic Disk Speed Test for Windows users in video production, or for anyone who wants a second opinion on sustained sequential performance.
PassMark PerformanceTest is a full system benchmark suite, and its disk test module is surprisingly capable. It runs sequential and random read/write tests, reports IOPS, and includes a set of advanced tests that simulate database operations, file server workloads, and threaded I/O patterns.
The results feed into PassMark's online database, where you can compare your drive's performance against thousands of other submissions. That community data is arguably the tool's biggest asset, as it lets you see how your specific SSD model performs across different systems and configurations.
Key Features:
• Sequential and random tests with IOPS reporting
• Advanced workload simulations (database, file server)
• Online comparison database with community submissions
Pros:
• Extensive online comparison data
• Tests beyond basic sequential/random patterns
Cons:
• The full suite is paid; disk-only testing is limited in the trial
• Overkill if you only need a quick SSD benchmark
Verdict:
Best suited for users who want to benchmark their entire system, not just the storage. The online comparison database is a genuinely useful resource.
AIDA64 is a heavyweight system diagnostic and benchmarking tool beloved by enthusiasts and IT professionals. Its disk benchmark module tests read, write, and mixed read/write performance with detailed control over block sizes, queue depths, and test durations.
Where AIDA64 really shines is context. It shows disk benchmark results alongside S.M.A.R.T. data, real-time temperatures, and detailed hardware information. You can see exactly how your SSD's performance relates to its thermal state, its interface speed, and the rest of your system configuration. It also includes an endurance test that pushes sustained write workloads for extended periods.
Key Features:
• Detailed disk benchmark with adjustable block size, QD, and test length
• Full S.M.A.R.T. monitoring with temperature tracking
• Comprehensive hardware diagnostics beyond storage
Pros:
• Unmatched depth of system and storage information
• Endurance testing for sustained workload evaluation
Cons:
• Paid software with a limited trial
• Overwhelming for users who just want a quick speed check
Verdict:
Overkill for casual benchmarking, invaluable for deep hardware analysis.
DiskGenius offers a built-in speed test that's worth knowing about, especially if you already use it for partition management or data recovery. You get benchmark results without installing another tool. Here's how to run your first test.
Step 1: Download and install DiskGenius.
Get the free version from the official DiskGenius website. The installation is straightforward and takes under a minute. Launch the application once it's done.
Step 2: Select the target drive.
In the main interface, you'll see a list of all connected disks and their partitions on the left panel. Click on the drive you want to benchmark. Make sure you select the correct disk, especially if you have multiple SSDs installed.
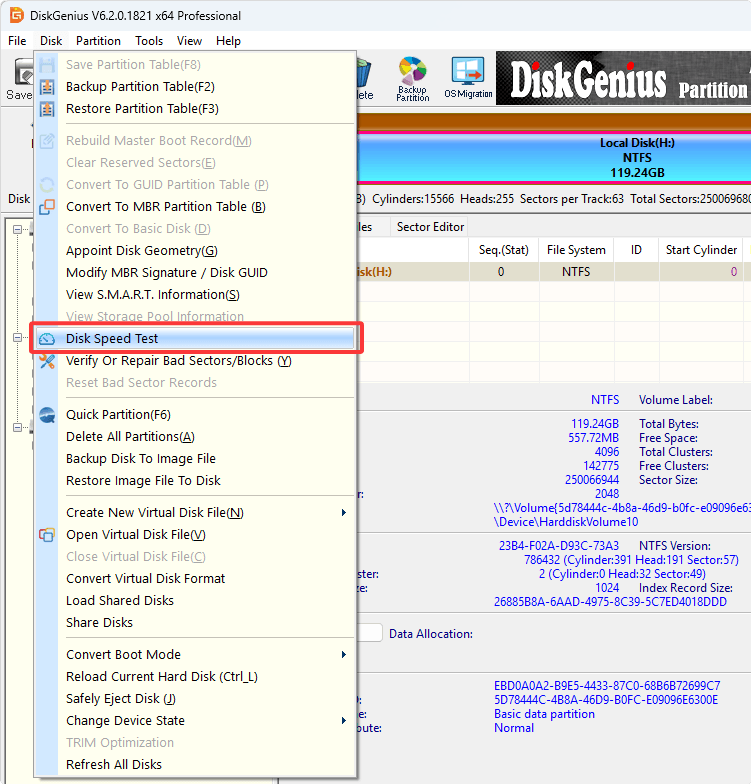
Step 3: Open the Disk Speed Test feature.
Navigate to the menu "Disk" and find the "Disk Speed Test" function. The tool will open a dedicated window where you can configure test parameters.

Step 4: Configure test settings.
First, you can choose File Test or Benchmark Test. Then set your preferred block size and test file size. For a quick check, the default settings work fine. If you want more thorough results, increase the test file size to at least 4 GB. Larger test sizes help bypass SLC caching, which can artificially inflate results on modern NVMe drives.

Step 5: Run the test.
Click the start button and let the test complete. Avoid using the computer for other tasks while the benchmark runs. Background activity can skew your numbers significantly.
Step 6: Read and record the results.
DiskGenius displays sequential read and write speeds in MB/s once the test finishes. Take note of both numbers. If you're comparing drives or tracking performance over time, save a screenshot or write down the results alongside the test configuration you used.
Getting a number is easy. Knowing what it means is the part most people skip.
Sequential read/write. This measures how fast your drive can read or write large, contiguous blocks of data. Think copying a 10 GB video file or installing a game. Sequential speeds are what manufacturers advertise, and they're the easiest numbers to inflate because they represent a best-case scenario.
Random 4K read/write (QD1). This is what actually makes your computer feel fast or slow. Random 4K at queue depth 1 simulates the kind of small, scattered read/write operations that happen constantly during normal use: launching an application, loading a web page, booting Windows. A drive with excellent random 4K performance will feel snappier in daily use than one with higher sequential speeds but mediocre random performance.
Queue depth. Queue depth (QD) refers to how many pending I/O requests the drive is handling simultaneously. QD1 is what you experience during light, everyday tasks. QD32 or higher is relevant to servers, databases, and heavily multitasked workloads. Most consumer scenarios stay at QD1 to QD4.
IOPS. Input/Output Operations Per Second. This metric matters most for random workloads. A drive that does 500,000 IOPS at 4K random read can handle a massive number of small requests without slowing down. For consumer use, anything above 500K IOPS is excellent.
Latency. Measured in microseconds, latency tells you how quickly a single I/O operation completes. Lower is better. Sub-100 microsecond latency at QD1 is good. Sub-50 is great.
SLC cache effects. Many modern SSDs use a portion of their NAND as a pseudo-SLC cache. When you write data to the drive, it first lands in this fast cache, which artificially boosts benchmark results. Once the cache fills up, write speeds can drop dramatically, sometimes by 50% or more. This is why a 1 GB test might show 6,000 MB/s while a 20 GB test on the same drive shows 2,000 MB/s. If you care about sustained performance, always test with a file size larger than the drive's known SLC cache.
The table below shows typical performance ranges by SSD interface type. Use these as rough reference points, not absolute standards. Results vary by drive model, capacity (higher-capacity drives are often faster), and test conditions.
| SSD Type | Typical Sequential Read | Typical Random 4K Read |
| SATA SSD | 500 - 600 MB/s | 30 - 40 MB/s (7K - 10K IOPS) |
| PCIe 3.0 NVMe | 3,000 - 3,500 MB/s | 40 - 60 MB/s (10K - 15K IOPS) |
| PCIe 4.0 NVMe | 5,000 - 7,500 MB/s | 60 - 90 MB/s (15K - 22K IOPS) |
| PCIe 5.0 NVMe | 10,000 - 14,000+ MB/s | 80 - 120+ MB/s (20K - 30K IOPS) |
A few things to keep in mind. Higher-capacity SSDs often benchmark faster than lower-capacity models from the same product line because they have more NAND chips operating in parallel. A 2 TB Gen 4 drive will typically outperform its 512 GB sibling. Also, sequential speeds scale more dramatically across generations than random 4K speeds do. Moving from SATA to Gen 4 NVMe gives you a 10x boost in sequential reads, but random 4K might only improve by 2x or 3x. That 2x to 3x is still what you'll actually feel during everyday use.
A bad benchmark is worse than no benchmark. It gives you a confident number that's also wrong. Here are the most common pitfalls.
Running tests on the OS drive while Windows is active. Your operating system is constantly reading and writing in the background: logging, updating, indexing, running services. All of that activity competes with your benchmark for drive bandwidth. For the most accurate results, test a secondary drive, or boot from a USB and test the OS drive while Windows isn't running.
Using test files that are too small. A 1 GB test file might fit entirely inside your SSD's SLC cache, producing results that look fantastic but don't reflect sustained performance. For NVMe drives, use at least 4 GB. For drives known to have large caches (some Gen 4 drives cache up to 70+ GB on the 2 TB models), go even bigger.
Only paying attention to sequential speeds. Manufacturers love to advertise sequential numbers because they're the biggest. But sequential performance tells you almost nothing about how a drive will feel during daily use. Random 4K at QD1 is the number that matters most for responsiveness. Always check it.
Forgetting to close other applications. Browser tabs, cloud sync clients, antivirus scans, Windows Update, all of these generate I/O activity that competes with your benchmark. Close everything you can before running a test.
Defragmenting an SSD. This comes up more often than you'd think. Defragmentation is for hard drives. It does nothing useful for SSDs and adds unnecessary write cycles. If your SSD seems slow, run TRIM instead. Most modern operating systems handle this automatically, but you can trigger it manually through DiskGenius, the Windows Optimize Drives tool, or manufacturer utilities.
Comparing results across different tools. DiskGenius at QD1 with a 1 GB file will give you a very different number than ATTO at QD32 with a 64 MB file. That doesn't mean one tool is wrong. They're measuring different things. Always compare results from the same tool, with the same settings, on the same system.
Speed is only half the picture. A drive that benchmarks well today might be on the verge of failure if its health indicators are deteriorating. Checking SSD health regularly takes two minutes and can save you from sudden data loss.
S.M.A.R.T. (Self-Monitoring, Analysis, and Reporting Technology) is a built-in system that tracks various health indicators on your drive.
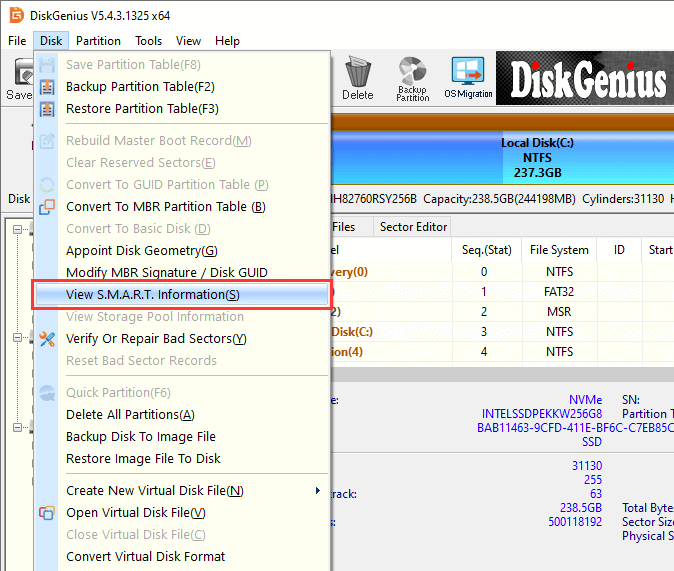
To view this data in DiskGenius Free, select your drive in the main interface and open the S.M.A.R.T. information panel: Disk – View S.M.A.R.T. Information.
You'll see a table of attributes with their current values, worst recorded values, and thresholds.
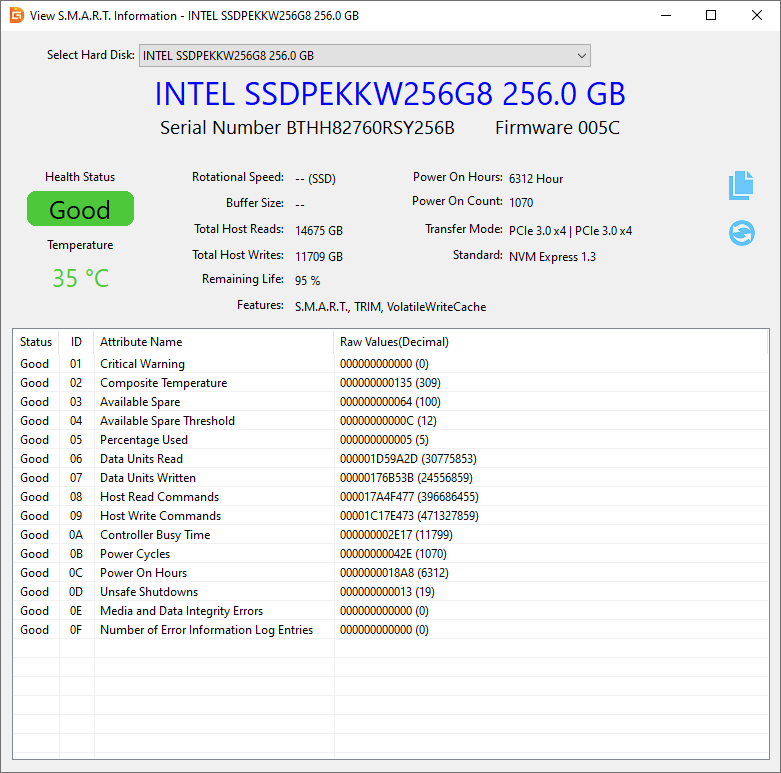
The attributes worth paying closest attention to:
• Reallocated Sectors Count. This tracks sectors that the drive has marked as bad and replaced with spare ones. Any value above zero on an SSD warrants attention.
• Wear Leveling Count. This reflects how much of the drive's rated write endurance has been consumed. A healthy drive shows a value close to 100. As it drops toward the threshold, the drive is nearing end of life.
• Temperature. SSDs perform best between 30 and 50 degrees Celsius. Sustained temperatures above 70 degrees trigger thermal throttling and can accelerate wear.
• Power-On Hours. A straightforward counter showing total operating time. Useful for evaluating used drives.
• Total Bytes Written. Compare this against the manufacturer's TBW (Terabytes Written) rating to gauge how much life remains.
DiskGenius displays all of these attributes in a clear, tabular format. If any attribute shows a "Warning" or "Bad" status, that's a signal to back up your data immediately and consider replacing the drive.
Beyond S.M.A.R.T. data, DiskGenius includes a bad sector detection feature that scans the entire drive surface.
Select the disk you want to test from the left pane, then click "Disk" – "Verify Or Repair Bad Sectors/Blocks".
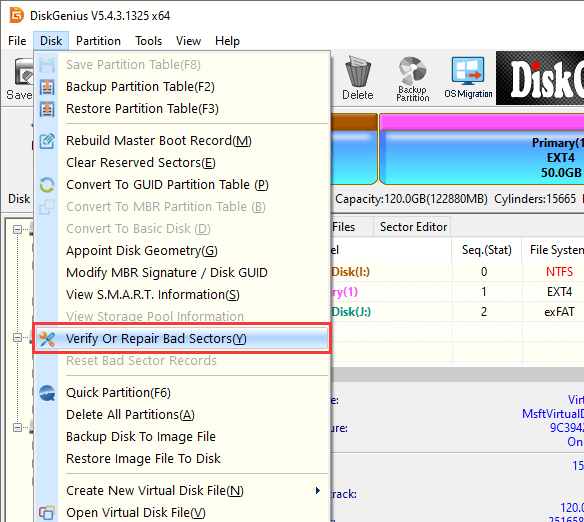
Click "Verify", and DiskGenius starts to scan the drive immediately.
During the scan, it reads every block and reports the read speed in real time. Blocks that read significantly slower than average may be developing problems, even if they haven't been formally reallocated yet.
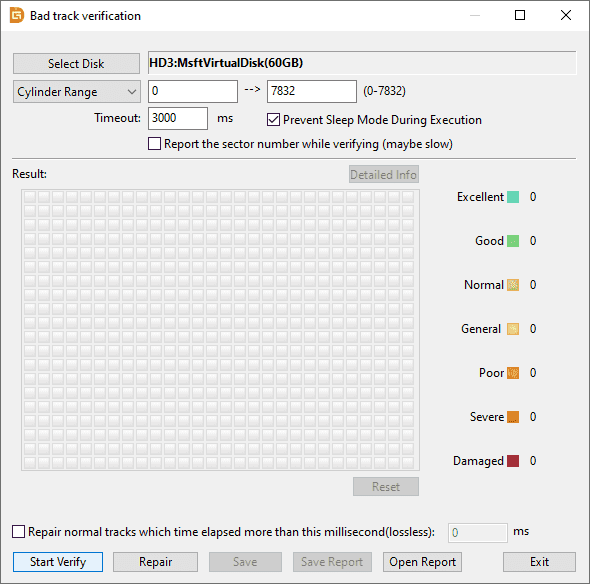
This real-time speed display during scanning is something you won't get from a pure benchmark tool. It combines health assessment with a practical performance snapshot, giving you a more complete view of your drive's condition than a speed test alone.
1. What is the best free SSD benchmark software for Windows?
DiskGenius Free Edition is free, portable, and produces results that are easy to compare. If you want benchmarking alongside partition management and data recovery, DiskGenius offers a built-in speed test as part of its broader toolkit.
2. How often should I benchmark my SSD?
There's no strict rule. Running a benchmark once when you first install a drive gives you a baseline. After that, checking every three to six months is enough for most users. If you notice a performance drop or suspect a problem, run one immediately. Frequent benchmarking won't harm your SSD; modern drives are rated for hundreds of terabytes written, and a benchmark writes a negligible amount.
3. Why are my SSD benchmark results lower than advertised?
Several factors contribute. Your drive's SLC cache might be filling up during the test, causing speed to drop. The test file size might be too small. Background processes could be consuming I/O bandwidth. Your drive might be connected through a slower interface than it supports (an NVMe drive in a PCIe x2 slot instead of x4, for example). Thermal throttling is another common culprit. Try increasing the test file size, closing all applications, and ensuring adequate airflow.
4. Does benchmarking void my SSD warranty?
No. Benchmarking is a normal, expected use case. No SSD manufacturer voids warranties for running speed tests. Even stress tests fall well within the drive's rated endurance specifications.
5. How do I check if my SSD is healthy?
S.M.A.R.T. data is the first place to look. Tools like DiskGenius can read and display these attributes. Look for reallocated sectors, wear leveling count, temperature, and total bytes written. For a deeper check, run a surface scan. DiskGenius includes this feature and shows real-time read speeds during the scan, which helps identify weak blocks before they fail completely.
SSD benchmark software isn't complicated, but it's surprisingly easy to get misleading results if you pick the wrong tool or make common testing mistakes. The good news is that you have plenty of solid options to choose from, and most of them are free.
Whatever tool you choose, test with large file sizes, close your background apps, pay attention to random 4K speeds, and check your results against the reference numbers in this guide. A few minutes of benchmarking can tell you more about your storage setup than any spec sheet ever will.
DiskGenius - A free disk partitioning tool that can resize partition, convert MBR to GPT without data loss, clone HDD to SSD, format SD card to FAT32, check SSD health, and more.

DiskGenius is a one-stop solution to recover lost data, manage partitions, and back up data in Windows.
Download Facebook
 YouTube
 X
X